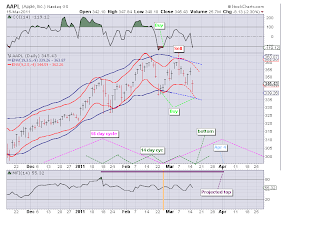
Appears APPL may have made a double top (forming an "M" pattern?). Looking at two shorter cycles a 14 day cycle should be bottoming and turn up for 7 trading days. A 56 day cycle should top around Apr 4. I would not be surprised if APPL makes a lower high Apr 4 (following the :M" pattern) as it appears an even longer cycle may have turned down.
Here is a picture:
GL traders, do your own analysis.
03-16 long term charts
Looking at the longer term it appears that the best case scenario is a range from $300-360. Not sure though it can maintain that range to the downside.
Here is the chart:
GL traders


Tidak ada komentar:
Posting Komentar