LIZ looks like it could be a buy around $6.75 - if it gets there over the next couple of days. Here is a chart:
Do your own analysis. GL traders.
01/06 update AH. Why should we wait for signals and not anticipate them. AH LIZ updated their 2H outlook, and it wasn't pretty. But, it will probably create a buy opportunity in the next 2-3 days. Wait.
Kamis, 06 Januari 2011
1-6 two more to watch
The stocks I am highlighting are down and a bottom is anticipated soon. Often there is a reason. The news may not be out yet (see LIZ and SVA updates about news today after they were presented). So always do your DD and do not anticipate a "buy" signal and move too soon!!!
Here are two more to watch for potential entry over the next 2-4 trading days:
Use caution - be patient these are low priced stocks and a small move can be a large percentage. GL traders.
Here are two more to watch for potential entry over the next 2-4 trading days:
Use caution - be patient these are low priced stocks and a small move can be a large percentage. GL traders.
Rabu, 05 Januari 2011
watch these two for potential buy
Here are two stocks that could be ready to buy in the next couple of days. Do your own DD.
These are lower priced (higher risk) stocks. Be sure - before you act. GL traders.
01/06 Update - SVA pre-market news was downbeat. Another example of why we wait for the signals.
These are lower priced (higher risk) stocks. Be sure - before you act. GL traders.
01/06 Update - SVA pre-market news was downbeat. Another example of why we wait for the signals.
Selasa, 04 Januari 2011
01-05 applying Fibonacci to time
Lots of people use FIBs to estimate price movements. But, how about to time? Not so much. So I did some research on the subject. From Aug 9, 1982 - (S&P 102.20 low) to Oct 11, 2007 (S&P 1576.90 high) is 25 years plus 2 month 2 days (25 x 365 + 6 leap days + 63 days = 9194 days). Note: 25 years should be about 1/2 of a K-wave (cycle).
Total days is: 9194 days.... So I constructed a FIB time grid based on 9194 days and placed it on a chart (8/9/82 to 10/11/07). The grid and chart follows:
What if the next 25 years, 2 months and 2 days mirror images the up wave to the downside? How will the projections work out?
10/11/07 + 0512 = 03/07/09 Crash low (Now this is interesting) 10/11/07 + 0839 = 01/28/10
10/11/07 + 1341 = 06/15/11
10/11/07 + 2170 = 09/20/13
So I looked at 0.00000 (10/11/07) to 0.23606 (09/20/13) using FIB time. But, too long a time period (10/11/07 - 9/30/13) into the future!!! Drilling down one more level starting at 0.38196 (0829 days) to 0.76393 (1658 days) for a span of 828 days (1658 - 830). I built a new FIB time grid.
Better, but I drill down one more time (0.38198 - 11/30/10 to 0.76493 - 10/12/11. Then we create a chart for FIB time grid IV. Following is the FIB time grids and a chart for Time Grid IV:
Watch the FIB lines for pivot points in 2011. Notice the FIB lines and tops and bottoms of the projected 20 week cycle. Hope you find this as interesting as I did in doing the research,
GL traders.
Total days is: 9194 days.... So I constructed a FIB time grid based on 9194 days and placed it on a chart (8/9/82 to 10/11/07). The grid and chart follows:
What if the next 25 years, 2 months and 2 days mirror images the up wave to the downside? How will the projections work out?
10/11/07 + 0512 = 03/07/09 Crash low (Now this is interesting) 10/11/07 + 0839 = 01/28/10
10/11/07 + 1341 = 06/15/11
10/11/07 + 2170 = 09/20/13
So I looked at 0.00000 (10/11/07) to 0.23606 (09/20/13) using FIB time. But, too long a time period (10/11/07 - 9/30/13) into the future!!! Drilling down one more level starting at 0.38196 (0829 days) to 0.76393 (1658 days) for a span of 828 days (1658 - 830). I built a new FIB time grid.
Better, but I drill down one more time (0.38198 - 11/30/10 to 0.76493 - 10/12/11. Then we create a chart for FIB time grid IV. Following is the FIB time grids and a chart for Time Grid IV:
Watch the FIB lines for pivot points in 2011. Notice the FIB lines and tops and bottoms of the projected 20 week cycle. Hope you find this as interesting as I did in doing the research,
GL traders.
01-04 January outlook
Time to take a look at January. My December outlook was definitely too pessimistic. Hope I do better on January. The 41 month cycle topped mid November and is down. The two year cycle is down and should bottom second half of April. The 1 year cycle is up the first 2.5 weeks of January (1/19 top?) before it turns down. So by late January we have 3 long cycle down. May give us some downward bias the last 1.5weeks of January, For now though the 1 year cycle seems dominant as it pushes higher to a top.
So looking at the longer cycles it appears upward bias the first 2 and half weeks of January and a downward bias the last week and half of January. Here is a SPX chart showing the longer cycles:
Now to look at the shorter swing cycles. The 20 week cycle is down and should bottom next week (1/11?). The 34td (trading days) cycle should bottom also next week (1/13?). the 22td cycle is up and should top next week (1/14?). So two cycles up, 2 cycles down - they largely offset. Maybe a slight bias down. Not enough to give us much dowside action though the first part of January. Here is the SPX showing the Swing cycles:
So, January is mostly sideways (a trader's market). Maybe up to 1280+ by 1 year cycle top (1/19?). Buy the dips of 1-2% and sell the pops. Don't get greedy expecting big moves either way. GL traders
So looking at the longer cycles it appears upward bias the first 2 and half weeks of January and a downward bias the last week and half of January. Here is a SPX chart showing the longer cycles:
Now to look at the shorter swing cycles. The 20 week cycle is down and should bottom next week (1/11?). The 34td (trading days) cycle should bottom also next week (1/13?). the 22td cycle is up and should top next week (1/14?). So two cycles up, 2 cycles down - they largely offset. Maybe a slight bias down. Not enough to give us much dowside action though the first part of January. Here is the SPX showing the Swing cycles:
So, January is mostly sideways (a trader's market). Maybe up to 1280+ by 1 year cycle top (1/19?). Buy the dips of 1-2% and sell the pops. Don't get greedy expecting big moves either way. GL traders
Sabtu, 01 Januari 2011
01-01 week ahead
The past 2 weeks I have told you to look for a basically flat market. We saw minor gains in the S&P, but it was less than 1% over that 2 weeks, so I believe we can agree that the basically flat call was a reasonable call.
So what does the new year hold? If my interpretation is right the 1 year cycle should top soon and turn down. We have a couple of other shorter cycles down this week. The 22td cycle is up for the next 2 weeks. Overall though I think the weight of the cycles should give us some downside by the end of the week.
It is my opinion we could get almost a 2% downside move sometime within the next 5 trading days (from higher levels -1265?) to around 1242 on the S&P. I think the odds of a downside move are 65-70% this week.
Here is the SPX chart:
Gl traders, keep your stops fairly tight to preserve profits.
Update comments 01/03 6:00 am
So what does the new year hold? If my interpretation is right the 1 year cycle should top soon and turn down. We have a couple of other shorter cycles down this week. The 22td cycle is up for the next 2 weeks. Overall though I think the weight of the cycles should give us some downside by the end of the week.
It is my opinion we could get almost a 2% downside move sometime within the next 5 trading days (from higher levels -1265?) to around 1242 on the S&P. I think the odds of a downside move are 65-70% this week.
Here is the SPX chart:
Gl traders, keep your stops fairly tight to preserve profits.
Update comments 01/03 6:00 am
01-01 Don't blindly act on signals
When you use indicators (CCI, MACD, RSI, etc) you try and evaluate them in overall context of the stock. If there are other factors that have you concerned you may not follow the signal. The same is true for cycle analysis. There are times we will choose to ignore a "buy" signal for example.
Let me show you what I mean. We have one stock giving buy signals at a time it looks like we have 3 swing cycles bottomed or bottoming. Now this is a signal we probably want to act on. Here is that stock:
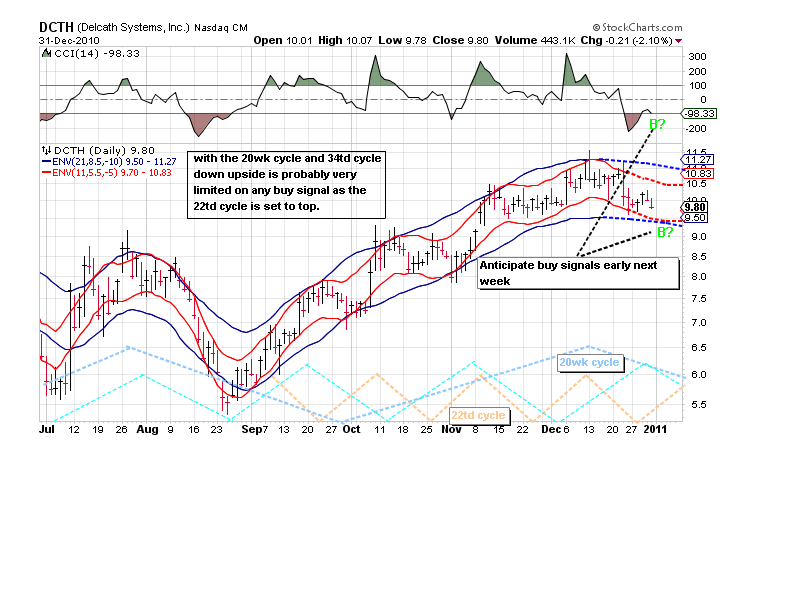
We have another stock we anticipate will give buy signals early next week. But it has 2 cycles down and a third ready to top and turn down. So any "buy" signal offers very little upside potential and considerable downside risk. This (if it happens) will be "buy" signals we ignore and pass on trading this stock. Here is the stock:
Always do your own due diligence and analysis. I can, have, and will be wrong at times because I did not consider all factors. I use these two stocks to illustrate a point and am not reccomending either. Let's work together to make 2011 a very profitable year.
Let me show you what I mean. We have one stock giving buy signals at a time it looks like we have 3 swing cycles bottomed or bottoming. Now this is a signal we probably want to act on. Here is that stock:
We have another stock we anticipate will give buy signals early next week. But it has 2 cycles down and a third ready to top and turn down. So any "buy" signal offers very little upside potential and considerable downside risk. This (if it happens) will be "buy" signals we ignore and pass on trading this stock. Here is the stock:
Always do your own due diligence and analysis. I can, have, and will be wrong at times because I did not consider all factors. I use these two stocks to illustrate a point and am not reccomending either. Let's work together to make 2011 a very profitable year.
Langganan:
Postingan (Atom)