Senin, 23 April 2012

04-23-2012 the week ahead

I told you last week to expect a sideways week with a slight upside bias.  Even though there was a lot of movement at the end of the week that is what we got.

It appears the short cyle (1/8 the Wall cycle 12-13 days) topped and turned down.  The 1/4 Wall cycle remains up.  The Half Wall and Wall cycle are down.  Also the Kitchin cycle should be entering a hard down phase.

Over all it appears we should have a down week, and I suspect we may test recent lows and potentially head lower after that.

Here is a visual:

GL traders.  I will probably not be posting for a few weeks.  The market should be in correction mode the next 4-5 months.  There will be bounces, so be careful.

Selasa, 17 April 2012

04-17-2010 observations

Th downturn is now taking a break as the shorter 1/4 Wall cycle has turned up.  This will probably last a week or a bit more.  The 1/2 wall cycle is down, the wall cycle is down but these will take a few days to build downside momentum.  Could we set a new S&P high?  Maybe, but I am doubtful this will happen as the Kitchin Cycle should be entering a "hard down" phase.  Overall - it appears we trend sideways with a slight upside bias near term (next week or so).

Here is a visual:

GL traders. 

Probably 1 more post before I enter the hospital  for needed surgery after which I expect to be offline for at least 3-4 weeks as I recover.  The next few weeks (and months) could get very interesting as we get a preview of the upcoming bottom in 2013-2014 as several major cycles bottom by 2014. The Kitchin cycle bottoming by mid-September or early October this year gives you that preview.

Minggu, 15 April 2012

04-15-2012 Going forward

I have encountered some health issues (not insignificant) and may at times be unable to post relevant information in a timely manner over the next few months.  I am hopeful I can overcome my health issues over the next few months.  I appreciate ll your support  the past 1.5 years and  wish you the best of luck in your trading.  Your best wishes and prayers are GREATLY appreciated.  Inlet

Jumat, 06 April 2012

04-09-2012 observations

If you looked close at the last set of charts posted you say that as of the end of March (First of April) both the 20 week Wall cycle and 10 week (1/2) Wall were down.  This was enough to cause this past week to be down.  This combination continues this week and expectations are we get a second down week, 

The downside objective is around 1345 (1340-1350) for the week.  The downside for April is lower as the 20 week Wall cycle does not bottom until late April (early May).  Also keep in mind the Kitchin Cycle should start adding some serious downside by mid April.  So a downside of 1300 or lower would not surprise by the end of the month,

We could talk about no new QE by the FED, Spain, or the employment #s - but then the talking heads on CNBC would have nothing to talk about....  Here is a zoomed in chart of the S&P:

GL traders.  Sold 1/5 of my RWM that I bought about a week ago for about a 2% profit.  Starting to get my cost on RWM down closer to current prices.  

Minggu, 01 April 2012

04-01-2012 April and beyond - observations

We know Nenner is calling for a top in the 1440s by mid April.  How does that mesh with our analysis?  Recently we have focused primary on the Kitchin cycle and its component cycles.

The Kitchin is 42-54 months in length.  For convenience we have used 42 months in our discussion (measured bottom to bottom).  The up leg of the Kitchin tends to be longer than the down phase.  Of the 42 months the up phase will normally take 2 1/2 years (30 months) and the down phase 12 months (or more).  So the cycle is not perfectly symmetrical as depicted on my charts.

The Kitchen cycle is actually a business cycle (sometimes called the inventory cycle) that we apply to stock analysis.   The Kitchin cycle is often mistakenly called the 4 year cycle.  The Kitchin cycle is composed of shorter cycles.  One  third of it as a sub-division (14 months  or around 300 trading days).  Each third of a Kitchin cycle is made up of 3 Wall cycles (about 4.5 months or 100 trading days).  Each third Wall cycle tends to be the weakest in a group of 3 - that is the Wall that is within the downside of the 1/3 of a wall cycle so we see the impact of the 1/3 sub Kitchin cycle.  So within the Kitchin cycle the 3rd, 6th and 9th Wall cycles will be the weakest.

The reason to emphasize the Kitchin cycle is we are now 3 years plus into it and should be entering the are of maximum downside pressure (the last 1/8  or 6 months of the cycle).  Earliest bottom date could be 2nd week of September.  If the cycle runs long it could be later in 2012 or early in 2013 before it bottoms.  Given the expiration of Bush tax cuts, the payroll tax deduction, and the sequestering of funds starting in Jan 2013 it may run long.

Here is an ideal representation of the Kitchin cycle from the bottom in Mar 2009:


As you can see from the chart we should be in the "hard down" phase of the Kitchin cycle starting by mud-April.  This aligns with Nenner's prediction of a top by then.....  So I expect we could see a significant top in April.
Focusing in and looking at the 1/3 Kitchin cycle we see that we are in the 8th (of 9) Wall cycles within the Kitchin cycle.  Each Wall cycle is about 4 1/2 months so the current (8th) wall cycle should bottom in late April.  Then we go into the 9th Wall cycle (3rd in a group of 3) which tends to be weak.  This is rational as the Kitchin cycle should be moving hard down.  4 1/2 months from late April puts you into the mid September time frame where we will start looking for a bottom.  As mentioned above - there are tax ramifications Jan 2013 which could extend the down leg of the Kitchin cycle (42-54 months and we are using 42).  Note: Many refer to this as the 4 year or presidential election cycle.

Take a close up look at the Kitchin third and Wall cycles:


In summary  - we have the Kitchin ready to enter a hard down phase.  We have the 3rd of 3 (9th) Wall cycle on deck and normally this would be a weak cycle.  So April (as Nenner predicts) could be a pivotal month for a change in trend.

Gl traders

Kamis, 29 Maret 2012

03-30-2012 Martin Armstrong

There are few if any experts thought more highly of than Martin Armstrong.  Here are recent thoughts from him:

http://www.safehaven.com/article/24880/martin-armstrong-on-the-sovereign-debt-crisis

GL readers

03-30-2012 Charles Nenner speaking out

Been a while (several months) since I have seen anything from Nenner.  Now there are multiple articles in March.  His view seems to be the stock market tops by mid-April  and heads down.  I cannot argue with that and have talked about the 42 month Kitchen cycle which bottomed in March 2009 and should bottom around mid Sept 2012.  With longer cycles you tend to get the most downside in about the last 1/8th of the cycle  (1/8 x 42 = 5.25 months.  October less 5 months is April, or time to head south).

Nenner also says he got out of gold last year around $1900, but it is now time to buy gold (and silver) with a target of $2500 on gold ($50+ on silver).  But instead of me telling you - read for yourself - here are the links:

http://www.businessinsider.com/gold-2500-2012-3

http://www.forbes.com/sites/johnnavin/2012/03/25/an-interview-with-technical-analyst-charles-nenner/?feed=rss_home

http://finance.yahoo.com/blogs/breakout/market-rally-peak-next-month-charles-nenner-150005109.html

Gl traders

Minggu, 25 Maret 2012

03-25-2012 observations

We said last week we expected the market to flatten and then turn down.  I would say that is close to what happened.   This week we expect the market to grudgingly give some ground.  Since it is end of month and end of quarter we may see some portfolio adjustments.  A fund that has seen APPL (IBM) exceed 5 % of the portfolio because of its rise may have to trim back under 5% (if they limit any one position to 5%).  So we could see some weakness in high fliers if this happens.  Not sure to what extent this could be an issue, but if high fliers give ground then the market as a whole will give ground.  Just something to keep in mind.

Longer term is operation "Twist".  QE1 and QE2 both boosted equities in the spring of 2010 and 2011.  TWIST seems to be doing the same this year as the FED sells short term bonds and buys longer term bonds as it attempts to suppress longer term rates.  This has been working, but 10 year rates have started to move up, so maybe the FED is out of ammo.  Seems they are running out of short term bonds to sell.    I suspect we may see a repeat of a sell off as the FED operation "Twist" comes to an end same as we did at the end of QE1 and QE2.  And "Twist" may be coming to an end sooner than expected - which could lead to a market downturn as early as April/May  (there is some indication of that in the cycles). 

Here is the SPX:

 GL traders, have a profitable week.

Rabu, 21 Maret 2012

03-21-2012 Charts from Victor

Hi Inlet,

So I have an 80/40/20/10 day cycle chart here and it seems to be in line up to a year back.  I guess my question is how valid is this?  I noticed that you used to reference it but have switched to a Wall Cycle and it now lines up differently because the periods are different lengths

tx,

v
 Note: Victor - I inverted colors on your charts to try and make them a bit more readable....  Here are the charts:
Second chart:
Victor - BTW - nice job on the charts.  To try and answer your question - I have no license that says my interpretation will always be correct.  Your interpretation may be the correct one.    I am just glad you are taking the time and interest to do you own analysis.  I try and find the interpretation that bests fits the data.  I may or may not find that best fit. 
Your 80 day length closely tracks T-Theory  (see blogs I follow - Terry Laundry - he uses 16 weeks and 5 x 16 = 80). 
Appreciate your input.

Update: For clarity here is Victor's Chart  #1 reproduced on StockCharts.  Any errors are strictly mine:

Selasa, 20 Maret 2012

03-21-2012 observations

Not much of a change from last post.  I had speculated a 1410 high (we got 1412+ I believe).  I also speculated we would get a flattening out (with today's pullback that may be happening).  After that we should see a bit of a pullback (under 1400 - maybe 1375).  Not the time for a huge pullback yet - got to get all the sheep rounded up for the shearing first?

Here is an updated picture:

GL traders  

Jumat, 16 Maret 2012

03-16-2012 observations

We broke above 1400 target.  Seems though the market is losing upside momentum.  The DOW has been up 7 (or is it 8) days in a row and runs like this are rare and overdue a rest.  I suspect we could see 1408-1410 as a top.

In looking at the charts is see once we reach this juncture of cycles though the market tends to go flat for 4-5 days.  Here is the SPX showing this:

GL traders

Selasa, 13 Maret 2012

03-14-2012 outlook

A week ago I told you I believed the Qtr Wall cycle had bottomed and we would see a drift up for about 2 weeks.  The move up was much sharper than I thought and reached levels higher than I anticipated in such a short period.  It now looks as if we may be reaching a top looking at the 25TD DPO (1400?).  Tomorrow should give us a clearer picture.  It could go somewhat higher as it is still 3-5 TDs to the time that the qtr Wall should top.

Here is the outlook:

GL traders.  May buy more RWM if it breaks below $26.

Kamis, 08 Maret 2012

03-09-2012 Slow Sto

According to Robert McHugh if the Slow Sto stays above 20 for 2.5 months a sell off normally occurs (+/- 2 weeks). Here is the Slow STO:
Bought back RWM I sold on Tuesday.  GL traders.

Rabu, 07 Maret 2012

03-07-2012 outlook

Looked at some of the stock market blogs.  Seems several are talking about a substantial sell off (1200, 1100, 1000, and lower.  Now maybe they will be right (eventually), but it appears to me we set a bottom for the quarter Wall cycle (25TDs) yesterday.  We now have a substantial gap down that makes a target to be filled as the Quarter Wall cycle turns up.  So maybe we get the sell off many are calling for, but it is not going to be straight down.  I think we take the next 12 or so TDs repairing the damage from yesterday before we continue down (turn around Mar 19-20).

Here is an updated chart for SPX:
Given this outlook I cashed in 1/2 my RWM position yesterday for a 2+% profit.  I will look to buy more RWM down near $27.  GL traders.

Senin, 05 Maret 2012

03-06-2012 Cycles and Elliot Waves

Elliot Waves are a methodology of tracking cycles.  I find it tedious with lots of rules and exceptions.  But here Elliot Wave in theory as applied to the growth (inventory or Kitchin cycle and its sub cycles):

OK, that is the theory.  May not be a perfect fractal as I interpret the Kitchin being divided into 9 Wall cycles.  Still I check EW sites from time to time to verify my analysis.  I am not an EW analyst, but here is the latest EW counts according to my understanding:


Hope - this enlightens.  I feel cycles and Elliot Waves are two different approaches to extract the same information.  I believe cycles are the simpler approach.

GL traders

Jumat, 02 Maret 2012

03-02-2012 recession ahead

I have noticed that recessions generally start when the economic numbers are  at highs.  Many people tend to project today's numbers into the future - which is why they are surprised when the economy takes a tumble.  ECRI predicted a recession by the second quarter of 2012 back at the end of September.  They have an excellent record in calling recessions.  Now I could show you a lot of charts that claim to predict the future. 

Instead I am going to show you one chart.  It is not some prediction but shows the "data" (not some prediction) and is referred to a coincident indicator.  It is on the verge of falling into an area that normally precedes or coincides a recession.  Here is the chart:

You decide, recession or not.    

03-02-2012 outlook

I believe the 20 week Wall cycle has topped.  We could set a marginal new high today, but I believe the odds do not favor that outcome.  That does not mean we immediately fall 100 points on the S&P.  Why?  Because the shorter qtr Wall (about 25TDs is now up as it just bottomed) and that will give us dueling cycles.  I have tried to determine the likely result of this.  Using DPOs for the Wall cycle (about 210 points and the qtr wall cycle (56 points) it appears they should almost precisely offset over the next 12 or so TDs. 

As a result of this dominant cycle pushing down as another pushes up it would imply an increase in volatility.  So there may be increased short term trading opportunities.  Be careful and preserve your capital. 

Here is the SPX and the outlook:

GL traders.  Let's make some money.   

Selasa, 28 Februari 2012

Mar 2012 outlook

It appears the longer 20 week Wall cycle should top Mar 1.  At the same time you have shorter cycles that have just bottomed .  So we start the month with offsetting cycles.  It will take a week or more for the 20 week Wall cycle to build down side momentum.  I suspect we continue sideways at least thru the first full week of March.  We will have to see if the 20 week Wall cycle has enough strenth to give us a bit of down side.  By mid-March we get cycles sychronized to the downside  (Ides of March).

Here is how I see the SPX going into March:


Gl.  More of the same?

Senin, 27 Februari 2012

March 2012 spiral dates

http://spiraldates.com/2012/charts/scores_0312.png

02-27-2012 week ahead

This year so far reminds one of the start of 2011 when QE2 and excess liquidity by the FED was supporting stock prices.  The Fed claims there is no QE3, yet through interbank loans with the ECB they are supporting QE1 by the ECB - so we are seeing similar stock reaction.  So it seems to me there is QE3 by proxy by the ECB.  And this week we get additional QE (LTRO) from the ECB.  As with the FED (QE2 was less effective than QE1) one would expect ECB QE2  to be less effective than ECB QE1.  QE is the symptom of a problem, not a solution. 

Lat week we saw a new high on Monday (SPX) and then again on Friday.  I speculated Monday may be a high but lacked confidence (felt it may be later in the week or early this week).  With all the ECB liquidity flooding the world it supports higher equity prices so any pullback at this time is apt to be limited.  Still the market is over due a correction and it appears tops are in.  Here is the SPX:


GL traders.  If you used trailing stops for your long positions you should have had a good run.  It may be time to protect some of those gains.

Kamis, 23 Februari 2012

02-23-2012 Is APPL ready to top?

AAPL has had a heck of  a run last 3 months.  Today was the investor conference.  No dividend announced.  Pretty ho-hum event.  So I looked at the chart:


Appears Money flow (MFI) has reversed to an outflow, cycles topping (channel upper cycle lines may have crossed - sell).  I suspect it is topping.

GL traders.

Selasa, 21 Februari 2012

02-21-2012 update and comments

The 20 week cycle should top this week.  It may have topped today?  Let's see how tomorrow looks.  When it tops we will have the 22TD cycle and 20 week cycles down which should result in a pullback  of a few days.  Of course the 20 week cycle should give us a downside bias into early May.

Here are updated charts:

My plan is to buy RWM on any move up to $27 for a trade.  GL traders.

Kamis, 16 Februari 2012

02-17-2012 outlook and comments

I have tried to give you sufficient advance warning as to what I feel will be a top.  So far this week is playing out much as expected with the 22TD cycle having topped and the 20 week (Wall) cycle topping offsetting each other.

The question is how much more upside is left?  I looked at the 20 week DPO to try and come up with an answer.  It appears we may have  1-1.5 points of upside left for the SPX.  Of course, anytime you try to call a top (or bottom) getting it right requires some luck.  So 1360.44 or so appears to be the upside as projected by the 20 week DPO (amplitude). Here is a picture:

BTW - I understand Pretcher of Elliott Wave fame has a projected target of 1360.

I also show the CCI, and it has fallen below +100 which I use as a "sell" signal.  Over the past few days  and tonight I have shown you:
  • Cycles that appear to be topping
  • MFI that is headed down
  • CCI signaling sell
  • DPO projection nearly fulfilled
I am sure you have your own TA indicators (RSI, MACD, Stochs) you look at, but I try to add to the more commonly used TA indicators to supplement your analysis.

GL traders.

Selasa, 14 Februari 2012

02-15-2012 outlook and comments

In order to top (and turn down) it seems common sense - money has to quit flowing into stocks and turn down.  Can you agree with that?  So what is the Money Flow for the SPX telling us?  Take a look:

I have tried to update/refine the SPX chart:

It appears to me the 22TD cycle has topped and the Wall cycle (20 week) is at/near a top.  I expect we could be into a pullback by the end of the week or early next week.  We will see.

GL traders

02-14-2012 outlook and comments

The week started out as expected.  The 22TD cycle trying to move down, but the 20 week (Wall) cycle still has  2-3 weeks of upside left.  Which will win?  Near term the shorter cycle may have more amplitude on a daily basis - so we may see some pullback.   I see some calling for a substantial pullback - and we may get that in time.  I suspect that it is just not yet.

A level to watch is 1336.  If we can break below that level then we could get a healthy correction.  Here is a picture (FIB fan):

 GL traders

Minggu, 12 Februari 2012

02-12-2012 outlook and comments

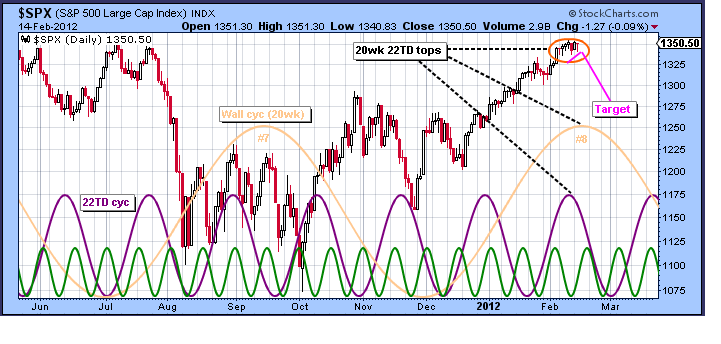
So far this year there has not been a lot to comment on when it comes to "swing trading" as the market powered upward. Of course, no market goes in one direction forever.  It appears that at this time the market is at or approaching a top.  Looking at the longer of the cycles I follow (the 20 week Wall Cycle) it appears it should top within about two weeks.

If we look at the Wall cycles in sets of 3 (since the 2009 bottom) we see that cycles 1, 4, 7 start an uptrend after substantial pullbacks.  Cycles 2, 5, 8 continue the upside that began with cycles 1, 4, 7  after a minimal pullback.  Cycles 3, 6, 9 (??) see  a substantial pullback. 

We are now in cycle 8 which is pushing upward and is expected to top  around Feb 23.  After which a pullback is expected over about 8-10 weeks into May.  If past patterns hold this pullback will be 5-10% or so (not a major correction).

Here is my interpretation of the Wall cycles:

So it is about time to take some money off the table if you are long and/or hedge long positions if you decide to hold them.

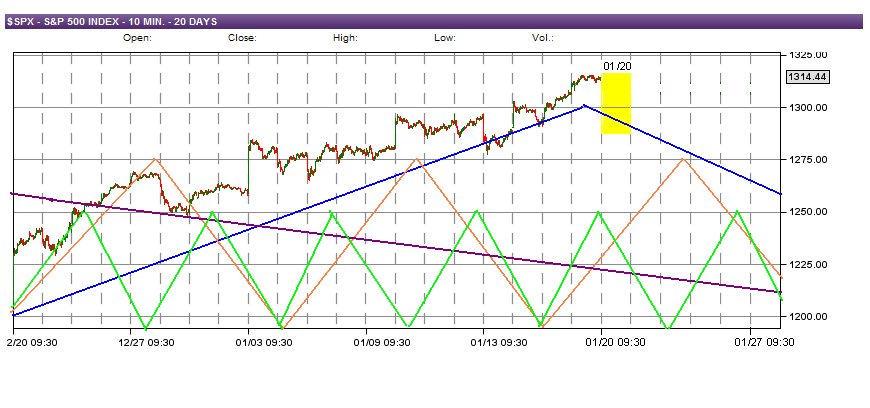
Shorter term it appears we have a 22TD cycle that topped this week and will be down the next weeks moving counter to the Wall cycle.  This should limit the upside from the Wall Cycle as we get a topping formation.  I do not expect much (if any) upside from here.  Here is my interpretation of this 22TD cycle:

My conclusion is: 1) take some money off the table (trim your longs?),  2) tighten your stops on positions you choose to continue to hold, 3) do some hedging (IE sell out of the money calls?).  GL traders

Update:  although not in exact agreement my analysis seems to align closely to Cliff Droke's latest comments: 

"The nearest weekly Kress cycle of intermediate-term consequence is scheduled to peak next Friday, Feb. 17 (plus or minus). A second interim weekly cycle will peak around March 9. There is a greater than average chance that one of these two cycles could put a significant peak on the market, though we won't know for sure which of the two dates is most likely to be the interim high until closer to the cycle peaks."

http://www.safehaven.com/article/24343/the-return-of-volatility

Kamis, 09 Februari 2012

02-10-2012 Cycles and PEs

Can PEs go lower?  They have seen single digits in the past during times of economic stress.  Here is the history of PEs (and their cycles):

GL traders

Selasa, 07 Februari 2012

Senin, 30 Januari 2012

VIX trend change signal - 01-30-2012

Several days ago the VIX declined more than 47.5% from its Nov 1 high setting the conditions for a trend change.  As confirmation we needed to see an actual direction change.  How do we judged that?  Three consecutive down days seems an appropriate confirmation.  Today was the third consecutive down day on the S&P completing the trend change signal.  Unfortunately, this tells us nothing about how long the change will last.  It could be a week or several weeks.  We do know that such signals occur infrequently (usually 2-3 times a year) and has proven reliable.  Also, not all trend changes generate a signal.

The MA channels generated a sell signal as the inner channel (upper channel line) crossed the outer channel (upper channel line).  The CCI dropped with attitude below the +100 line generating a sell signal.  Finally the MFI is trending down which normally happens at a top.

All the technicals seem to be aligning indicating a potential sell off.  Still the market is holding up better than one would expect.  Here is the SPX:

GL traders

feb 2012 spiral dates calendar

http://spiraldates.com/2012/charts/scores_0212.png

Kamis, 26 Januari 2012

01-26-2012 comments

The Fed spoke yesterday and the message seems clear - things are not great and they don't see much improvement between now and 2014.  So interest rates will remain near zero for the next 2.5-3 years into 2014.  Make no mistake the Fed will do its best to protect its banker constituents as it screws Ma and Pa.  How are Ma and Pa supposed to survive on their Social Security and $200k in CDs producing little or no income.

So the Fed knows what we have told you here before - the worst is yet to come.  With major long term cycles set to bottom in 2014 they do not see rates going up for about 3 years.  They view deflation as a real possible outcome.  I cannot disagree.  So homeowners default, banks foreclose  and properties are written off 30-60% of the collateral represented by that foreclosed home.  When collateral gets written down/off then there has to be an adjustment on the asset side of the balance sheet.  This leaves less assets for the bank to make loans.  Less assets (fiat currency) results in deflation.  We have seen what happens to asset value when there is a problem in a sector too BIG for the government to bail out like in the housing market.  We got major deflation as housing prices tanked.

Now imagine defaults on a larger scale as sovereign nations default and the effect that will have on bank assets.  It will not be pretty and it is unlikely the Central Banks can print their way out of it as demand for credit and credit worthy buyers disappear.  This could lead to demand for goods and services to take major hits and lead to a rash of corporate defaults as the negative cycle feeds on its self.  Do you really believe people with tens of thousands of CC or student loan debt are like to pay it off?  Housing mortgages defaults are apt to remain high for some time.  I would expect personal bankruptcies to soar.

So you have sovereign nations, corporations, and individuals repudiating debt.  This will lead to a major reduction in assets available to stave off deflation.  And as we saw from the Great Depression this can lead to long periods of economic stagnation.  Or, if you prefer - "welcome to Japan".

Short term the market behaved irrationally and went up.  Don't fight the Fed - the market is responding to the short term that the FED will push liquidity.  Long term the problem will exceed the FED's capacity to manage.  So any pullback is temporarily halted.  Long term it means once we get a pullback it will be bigger and faster than it would have bee otherwise.

GL

Rabu, 25 Januari 2012

01-25-2012 comments

Market is showing some weakness.  This was expected (but expected last week).  Still it is a drip, drip, drip type of weakness.  Seems earnings have been mixed and no longer pushing the market higher (OK, except APPL).  Could we have an event that produces a more vigorous sell off.  We could and I expect at some point we will. 

Today appears it will follow the pattern so far for the week.  The VIX fell over 50% from its high Nov 1.  so 3 consecutive down days should signal a trend change according to the rules I use. Use SPX to judge this (it would be better if all three fall, but so far we are getting mixed closes).

Here is the SPX:


GL    

Selasa, 24 Januari 2012

01-24-2012 comment

It appears the short 17-18 TD cycle in December was not a true cycle inversion, but a transition to a new dominant cycle (34TD to 45TD).  If this proves out we are now set up for some downside.  So lets see what the market gives us.

GL

Kamis, 19 Januari 2012

01-20-2012 outlook

So far we have had many of the major financial/banks report.  Seems to me that the results were very mixed.  WFC and a couple of larger regionals (BBT, USBancorp) looked good, the rest not so good.  I don't see this as a strong signal the economy is ready to soar.  Amex reported this evening and missed on revenues (a mixed report).

We got a slew of techs reporting after the close.  Seems the MSM is pumping it as a strong showing.  Seemed rather so-so to me.  IBM missed on revenues.  INTC beat on revenues and earnings, but had lowered expectations earlier.  MSFT was pretty much in line.  GOOG laid an egg.  In December ORCL had a notable miss.  Again - not the type of showing of a booming economy.

So we have financials with mixed results and techs with so-so results.  Not the booming economy some want us to believe. These are two large sectors of the economy and I suspect the market on inflated expectations has gotten ahead of reality.   We will see.

Here is the SPX outlook:

GL traders.  Nothing goes one way forever.  Sold the last of my trading longs today, so I am now short and cash.  The VIX broke 2 std deviations (47.5%) below its Nov 1 high - so 3 consecutive down days (as if that will ever happen again - hehehe) would signal a trend change.

01-19-2012 outlook

We should be at or very near the top.  There is a FIB level at 1310.33 which may well mark the top.  The 35TD cycle DPO (amplitude) is close to being fulfilled.  Other TA indicators are also indicating an imminent top.  Money Flow has ticked down and this normally happens just prior to a top.  RSI is approaching extreme levels.  Here is the big picture:

We have already gotten a sell signal from crossing channel lines.  Now this may have been a bit early, but in my opinion a signal should precede the event (topping in this case) to allow the trader time to consider and act.  Nothing is certain when it comes to the market so we may see marginally higher highs.  We have a shorter cycle topping tomorrow during the day and this should result at least a testing the 1310.33 FIB and may spike above that, but by Friday we should start our descent.  See for yourself:


GL traders.  Hope I am back in sync with the market.

Selasa, 17 Januari 2012

01-18-2012 outlook

I have been searching for an explanation of the data in terms of cycles for weeks now.  I was looking at David Knox Barker's recent depiction of the Wall Cycle:

OK, so this explains it - sort of.  The thing that caught my attention was the short QW3 cycle at the end of November and early December.  This had always been difficult to explain.  It is about half the other cycles.  If you do much research on cycles you will find some cycle analysts talk about cycles inverting.  In my experience this is not a common occurrence, but I do not discount the possibility.  We were going along with cycles averaging about 33-34TDs and we get a 17TD cycle.  This shifts the cycle tops and bottoms 1/2 a cycle and the top is where we had projected a bottom and the bottom is where we had projected a top.  In other words the cycle had inverted.  Here I show that:

If Barker's interpretation is correct and we had a cycle inversion (as it appears we did) then we should be topping and head down into early February.  GL traders.

Senin, 16 Januari 2012

the week of Jan 17 2012

I wish I could get a clearer reading on what is happening in the market.  At this time though I find no cycle combinations that seem to explain the market action.  Doesn't mean there isn't an explanation, just means I am unsure of what it is.  January is starting out the year showing strength (same as last year) - so maybe there is a one year cycle in play.  No high level of confidence in that.

Based on my cycle work I believed we would have topped by now (and maybe we did Friday?) and be showing weakness.  It seems we have achieved the levels (or more) one would expect from the amplitude of the DPO.  The CCI seems to be indicating a possible top.  Some other technical indicators like the MFI are also at extremes.

So what would it take to turn the market.  I suppose a bad report from a major company like IBM (the model of consistent performance) which has a new head that decides to do some house cleaning might do the trick.  All we can do is wait and see.

GL


Spiral dates top

Spiral dates says Jan 14 ideally will mark a top.

http://spiraldates.com/2012/charts/sp500_010612A.png

Minggu, 08 Januari 2012

The Jugular/Kitchin cycles bottom 2012

This is a preview of the coming K-Wave winter?


http://www.financialsense.com/contributors/chris-ciovacco/2012/01/06/yields-cycles-sentiment-say-gains-may-not-last

01-09 outlook for the week

We should have a longer multi-week cycle bottoming by the end of the week.  We have two multi-day cycles that appears will bottom by Thursday close.  We have a short cycle up two days then down two days into Thursday close.  For the week expect a low Thursday with a bit of recovery on Friday.

Here is the SPX:

Gl traders

Kamis, 05 Januari 2012

Always question everything.

I like David Knox Barker and his work.  I have repeatedly talked about the Kitchin and Wall cycles.  The one thing that bothers me about the Wall cycle (and his interpretation) is the variability he claims it has.  That can lead to a lot of personal bias and interpretation.    He gives a "typical" range of a Wall cycle of 8-32 weeks (that is a lot of range and leads a lot of room for personal biases/interpretation).

Now I believe we should interpret the data not insert our preconceived personal biases into our analysis.  So I have been thinking about this interpretation for a while and whether it is useful in interpreting the data.  I have come to believe it is of limited usefulness.  So I have looked at the data (several times) to see if there is an alternative interpretation to better explain the data.  Terry Landry of T-Theory  seems to favor a 15 week cycle.  There are 12 - 15 week (12 x 15 - 180 weeks) periods in a 42 month (Kitchin - 3 years 6 months or 3 X 52 + 26 = 182 weeks) cycle.  Here is a chart showing these 15 week cycles:

Seems to me this interpretation offers a more acceptable level of variability in cycle length than the 20 Week Wall cycle.  It still points to a low in mid January.  Always question everything/everybody and focus on whether the market data supports the interpretation.  Your feedback can help keep me on track....  

Senin, 02 Januari 2012

01-03-2012 outlook

How do we start the new year?  The evidence suggest we start the new year by pulling back the first few trading days and set a bottom by around Jan 11. 

Tuesday could well kick off the down side move.  Here is the SPX and my interpretation of the cycles:

GL traders.  May 2012 treat you kindly.