As I type this the S&P futures are up around 16 points. All based on the lame stream media reporting congress is close to a debt ceiling deal. Are they? Well, as I understand Senate rules it can take 2 days to get the final vote on any "deal" and they need 60 yea votes. Then any "deal" is by no means assured of passage in the House without changes when it goes to the House. So it seems to me you are looking at late August 2 or early August 3 before any "deal" is a "done deal" and possibly later than that.
Did you see that several large companies have been announcing cut backs. I think you will see the weekly unemployment #s move back up. I would not be surprised to see a 500K claim # within the next 2 months. So all this market weakness is about more than the Kabuki theater in DC. There is the problems in Europe, the GDP reports, and weakening employment situation. See my weekly and monthly outlooks for additional comments.
Our cycle charts is showing Monday down. How much? Hard to say - may depend on how hard CNBC pushes the "deal" is done topic. Still I believe we could test prior lows near 1260 within the first 2 days of the week as you have multiple cycles bottoming Tuesday (If I have the charts right).
Here is a visual:
GL traders. Do your own analysis. Yeah - futures are up big - but it is still 13+ hours until the market opens.
Minggu, 31 Juli 2011
Sabtu, 30 Juli 2011
comments and outlook for 08-01-2011
The Kabuki theater continues this weekend in DC. Make no mistake about it - this is to distract you from what is really going on. The situation in Europe continues to worsen. Italy had to pull a longer term bond offering because there was no demand. Interest rates in Italy and Spain are moving up. The EU (ECB) bailout plan is too small to support the banks in these two larger countries (banks in these countries hold a lot of sovereign debt). The Fed has been told not to offer the same level of interbank swaps as they did back in 2008-2009 crisis. The EU is between a rock and a hard place with no plan for dealing with a financial freeze up in Italy and/or Spain. If the European banks have to buy dollars in the open market the dollar will move up substantially as the Euro plunges. NOTE: money market funds have been reducing European exposure reducing the US$ available for over night lending in Europe.
Then there was the GDP report last week. The next revision almost surely will show negative growth in the first quarter. And the FED has told us the second quarter weakened from the 1st quarter. So you don't suppose the second quarter will be revised negative also do you? So you see why the PTBs are giving us Kabuki theater to distract us. But that can only go on a short time longer. In my monthly outlook I pointed out to you the Kitchin business cycle should have topped in December. You think that may have happened?
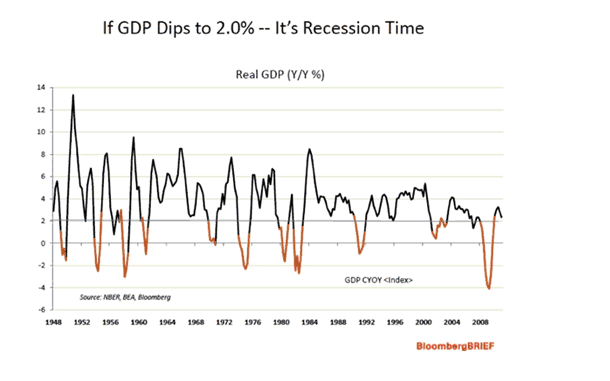
I came across a chart of GDP I think you will find interesting:
If GDP goes below 2% we have a recession. No way - the PTBs tell us things are improving slowly. Oops, didn't that just happen? Would you like nuts or sprinkles on that double dip. Okay, enough commentary.
We should see a bottom Tuesday during the day as several of the shorter and 34TD cycle bottom. Once these cycles turn up we should see a rise off of Tuesday's bottom. Interesting isn't it that our cycles show a bottom on Aug 2 - the day that most likely we see a deal done in DC. After the bottom we likely will see some up movement for 2-3 days. Friday could be flat to slightly up.
Here is a visual:
GL traders. Do your own analysis. You might want to try a long or two by Tuesday close (Wednesday open) but be careful and use stops. Refer to my monthly outlook - any moves up are apt to be short (no more that 4-5 days) and limited.
Then there was the GDP report last week. The next revision almost surely will show negative growth in the first quarter. And the FED has told us the second quarter weakened from the 1st quarter. So you don't suppose the second quarter will be revised negative also do you? So you see why the PTBs are giving us Kabuki theater to distract us. But that can only go on a short time longer. In my monthly outlook I pointed out to you the Kitchin business cycle should have topped in December. You think that may have happened?
I came across a chart of GDP I think you will find interesting:
If GDP goes below 2% we have a recession. No way - the PTBs tell us things are improving slowly. Oops, didn't that just happen? Would you like nuts or sprinkles on that double dip. Okay, enough commentary.
We should see a bottom Tuesday during the day as several of the shorter and 34TD cycle bottom. Once these cycles turn up we should see a rise off of Tuesday's bottom. Interesting isn't it that our cycles show a bottom on Aug 2 - the day that most likely we see a deal done in DC. After the bottom we likely will see some up movement for 2-3 days. Friday could be flat to slightly up.
Here is a visual:
GL traders. Do your own analysis. You might want to try a long or two by Tuesday close (Wednesday open) but be careful and use stops. Refer to my monthly outlook - any moves up are apt to be short (no more that 4-5 days) and limited.
Comments and outlook for August 2011
The Kitchin business cycle is 42 months ideally (may vary from 3-5 years). The bottom was around March 9, 2009. So half a cycle to the peak would be 21 months to around Dec 9, 2010. Given the revised GDP numbers for the first quarter and for the second quarter I think we are safe in saying we have seen a business slow down in the first half of 2011 (as we would expect if the Kitchin cycle peaked in late 2010). So BIG picture is we now have the business cycle slowing down and that should last another 14 months or so if we get a 42 month Kitchin cycle. March 2009 plus 42 months is 3.5 years or September 2012.
Within the Kitchin there are 9 Wall cycles of 20 weeks. The 6th wall Cycle of 9 should bottom in mid August. In addition we have a 22TD cycle topping now (Aug 1-2) and bottoming around Aug 17. The 34 TD cycle is bottoming now (Aug 1-2) and turning up. The 65TD cycle is topping and turning down. So in mid August we have the 22TD cycle bottoming along the 20 week cycle. The 65TD cycle is down into mid August and beyond.
So after Aug 2 (bottom?) we get a few days (my guess is 4-5 days) up from the 34TD cycle being up and after that the longer cycles along with the 22TD cycle abort any attempt to rally. So I am looking for lower highs followed by lower lows in by mid August. After the low in mid August we will get another attempt at rallying but you have the 65TD cycle still down. The 20 week cycle will have turned up, but will take some time to gather upward momentum. Finally the 34TD cycle will top the third week in August and turn down. So I expect the rally after August 17 to be rather weak also (another lower high?). This should play into a rather major bottom in mid September.
Here is a chart of these longer cycles:
The minor top in early August should be around Aug 8-9 . The minor top in the second half of Aug should be around Aug 25. We should see a bottom the first 2 days of Aug, and another bottom around Aug 17. There is a third minor bottom that should occur in early Sept. The mid month bottom is the most significant bottom in August. Here is a zoom in chart of the shorter cycles showing Aug:
GL traders. I have tried to summarize August without being too verbose. Do you own analysis. Comments, feedback and your opinions always welcome.
Update 07-31 08:30 EDT:
Here is a graph of seasonal trends for August. Compare it to our cycle outlook:
Within the Kitchin there are 9 Wall cycles of 20 weeks. The 6th wall Cycle of 9 should bottom in mid August. In addition we have a 22TD cycle topping now (Aug 1-2) and bottoming around Aug 17. The 34 TD cycle is bottoming now (Aug 1-2) and turning up. The 65TD cycle is topping and turning down. So in mid August we have the 22TD cycle bottoming along the 20 week cycle. The 65TD cycle is down into mid August and beyond.
So after Aug 2 (bottom?) we get a few days (my guess is 4-5 days) up from the 34TD cycle being up and after that the longer cycles along with the 22TD cycle abort any attempt to rally. So I am looking for lower highs followed by lower lows in by mid August. After the low in mid August we will get another attempt at rallying but you have the 65TD cycle still down. The 20 week cycle will have turned up, but will take some time to gather upward momentum. Finally the 34TD cycle will top the third week in August and turn down. So I expect the rally after August 17 to be rather weak also (another lower high?). This should play into a rather major bottom in mid September.
Here is a chart of these longer cycles:
The minor top in early August should be around Aug 8-9 . The minor top in the second half of Aug should be around Aug 25. We should see a bottom the first 2 days of Aug, and another bottom around Aug 17. There is a third minor bottom that should occur in early Sept. The mid month bottom is the most significant bottom in August. Here is a zoom in chart of the shorter cycles showing Aug:
GL traders. I have tried to summarize August without being too verbose. Do you own analysis. Comments, feedback and your opinions always welcome.
Update 07-31 08:30 EDT:
Here is a graph of seasonal trends for August. Compare it to our cycle outlook:
Kamis, 28 Juli 2011
Comments and outlook for 07-29-2011
Today's outlook was too pessimistic. Still we closed down as the 34TD cycle dominance again overcame a rally attempt. The 34TD cycle continues down for 2 more days (if I have it positioned correctly).
So we have the 20 week cycle still down and the 65-70 day cycle up (topping soon). The 34TD cycle is down (bottoming soon). The 22TD cycle is up (topping soon). The 11.2TD cycle is down (bottoming soon). With all these cycles topping/bottoming we should see increased volatility over the next few days.
The 5.6TD cycle is down. The 2.8TD cycle is up. Overall I expect the downside bias to continue Friday. Will we test the 1280 level? Based on cycles it is possible, but probably not. Of course if the news is negative on the debt ceiling Kabuki theater anything is possible.
Here is the SPX:
GL traders. Do your own analysis. Get your long list ready, we should bottom early next week.
So we have the 20 week cycle still down and the 65-70 day cycle up (topping soon). The 34TD cycle is down (bottoming soon). The 22TD cycle is up (topping soon). The 11.2TD cycle is down (bottoming soon). With all these cycles topping/bottoming we should see increased volatility over the next few days.
The 5.6TD cycle is down. The 2.8TD cycle is up. Overall I expect the downside bias to continue Friday. Will we test the 1280 level? Based on cycles it is possible, but probably not. Of course if the news is negative on the debt ceiling Kabuki theater anything is possible.
Here is the SPX:
GL traders. Do your own analysis. Get your long list ready, we should bottom early next week.
Rabu, 27 Juli 2011
Comments and outlook for 07-28-2011
As I indicated in my 07-27 post it seemed the 34 day cycle (down) was starting to exert dominance (down). It showed up in full force today. Can this dominance last? I believe it can 1-2 more days at least.
Today the 5.6TD cycle topped and is down tomorrow. The 2.8TD cycle bottomed and is now up. The 11.2TD cycle continues down. The 22TD cycle continues up. The 34TD cycle is down. The 65-70TD (3 month reporting cycle is up and will top soon). The 20 week Wall cycle is down.
So if I am right and the 34TD cycle is dominating the bias tomorrow is down. So we trade in a range of 1329 (maybe it should be 1310) to 1279. I believe we could see some significant downside tomorrow, maybe not 1279, but 1290 definitely seems possible.
Here is the SPX:
GL traders. Do your own analysis, warning bears in the area.
Today the 5.6TD cycle topped and is down tomorrow. The 2.8TD cycle bottomed and is now up. The 11.2TD cycle continues down. The 22TD cycle continues up. The 34TD cycle is down. The 65-70TD (3 month reporting cycle is up and will top soon). The 20 week Wall cycle is down.
So if I am right and the 34TD cycle is dominating the bias tomorrow is down. So we trade in a range of 1329 (maybe it should be 1310) to 1279. I believe we could see some significant downside tomorrow, maybe not 1279, but 1290 definitely seems possible.
Here is the SPX:
GL traders. Do your own analysis, warning bears in the area.
Selasa, 26 Juli 2011
Comments and outlook for 07-27-2011
Today was flat and traded in a narrow range. It hit the bottom of the expected range and traded mostly in the lower half of the range I posted. I thought we might close slightly up, but the market sold down the last half hour.
Tomorrow looks like another flat day. It seemed that last week the 22TD cycle was dominant, but it now appears the 34TD cycle has assumed dominance. If true that gives a downside bias to the market the rest of the week.
The 34TD cycle is down, the 22TD cycle is up. The 11.2TD cycle is down. The 5.6TD cycle is up. the 2.8TD cycle should top mid day. The 20 week cycle is down, the 65TD cycle is up. Overall the cycles cancel out (mostly). But, I believe there is a slight down side bias and we trade sideways in a range of 1310-1342.
Here is the SPX:
GL traders. Do your own analysis.
Tomorrow looks like another flat day. It seemed that last week the 22TD cycle was dominant, but it now appears the 34TD cycle has assumed dominance. If true that gives a downside bias to the market the rest of the week.
The 34TD cycle is down, the 22TD cycle is up. The 11.2TD cycle is down. The 5.6TD cycle is up. the 2.8TD cycle should top mid day. The 20 week cycle is down, the 65TD cycle is up. Overall the cycles cancel out (mostly). But, I believe there is a slight down side bias and we trade sideways in a range of 1310-1342.
Here is the SPX:
GL traders. Do your own analysis.
Langganan:
Postingan (Atom)