Senin, 30 Januari 2012

VIX trend change signal - 01-30-2012

Several days ago the VIX declined more than 47.5% from its Nov 1 high setting the conditions for a trend change.  As confirmation we needed to see an actual direction change.  How do we judged that?  Three consecutive down days seems an appropriate confirmation.  Today was the third consecutive down day on the S&P completing the trend change signal.  Unfortunately, this tells us nothing about how long the change will last.  It could be a week or several weeks.  We do know that such signals occur infrequently (usually 2-3 times a year) and has proven reliable.  Also, not all trend changes generate a signal.

The MA channels generated a sell signal as the inner channel (upper channel line) crossed the outer channel (upper channel line).  The CCI dropped with attitude below the +100 line generating a sell signal.  Finally the MFI is trending down which normally happens at a top.

All the technicals seem to be aligning indicating a potential sell off.  Still the market is holding up better than one would expect.  Here is the SPX:

GL traders

feb 2012 spiral dates calendar

http://spiraldates.com/2012/charts/scores_0212.png

Kamis, 26 Januari 2012

01-26-2012 comments

The Fed spoke yesterday and the message seems clear - things are not great and they don't see much improvement between now and 2014.  So interest rates will remain near zero for the next 2.5-3 years into 2014.  Make no mistake the Fed will do its best to protect its banker constituents as it screws Ma and Pa.  How are Ma and Pa supposed to survive on their Social Security and $200k in CDs producing little or no income.

So the Fed knows what we have told you here before - the worst is yet to come.  With major long term cycles set to bottom in 2014 they do not see rates going up for about 3 years.  They view deflation as a real possible outcome.  I cannot disagree.  So homeowners default, banks foreclose  and properties are written off 30-60% of the collateral represented by that foreclosed home.  When collateral gets written down/off then there has to be an adjustment on the asset side of the balance sheet.  This leaves less assets for the bank to make loans.  Less assets (fiat currency) results in deflation.  We have seen what happens to asset value when there is a problem in a sector too BIG for the government to bail out like in the housing market.  We got major deflation as housing prices tanked.

Now imagine defaults on a larger scale as sovereign nations default and the effect that will have on bank assets.  It will not be pretty and it is unlikely the Central Banks can print their way out of it as demand for credit and credit worthy buyers disappear.  This could lead to demand for goods and services to take major hits and lead to a rash of corporate defaults as the negative cycle feeds on its self.  Do you really believe people with tens of thousands of CC or student loan debt are like to pay it off?  Housing mortgages defaults are apt to remain high for some time.  I would expect personal bankruptcies to soar.

So you have sovereign nations, corporations, and individuals repudiating debt.  This will lead to a major reduction in assets available to stave off deflation.  And as we saw from the Great Depression this can lead to long periods of economic stagnation.  Or, if you prefer - "welcome to Japan".

Short term the market behaved irrationally and went up.  Don't fight the Fed - the market is responding to the short term that the FED will push liquidity.  Long term the problem will exceed the FED's capacity to manage.  So any pullback is temporarily halted.  Long term it means once we get a pullback it will be bigger and faster than it would have bee otherwise.

GL

Rabu, 25 Januari 2012

01-25-2012 comments

Market is showing some weakness.  This was expected (but expected last week).  Still it is a drip, drip, drip type of weakness.  Seems earnings have been mixed and no longer pushing the market higher (OK, except APPL).  Could we have an event that produces a more vigorous sell off.  We could and I expect at some point we will. 

Today appears it will follow the pattern so far for the week.  The VIX fell over 50% from its high Nov 1.  so 3 consecutive down days should signal a trend change according to the rules I use. Use SPX to judge this (it would be better if all three fall, but so far we are getting mixed closes).

Here is the SPX:


GL    

Selasa, 24 Januari 2012

01-24-2012 comment

It appears the short 17-18 TD cycle in December was not a true cycle inversion, but a transition to a new dominant cycle (34TD to 45TD).  If this proves out we are now set up for some downside.  So lets see what the market gives us.

GL

Kamis, 19 Januari 2012

01-20-2012 outlook

So far we have had many of the major financial/banks report.  Seems to me that the results were very mixed.  WFC and a couple of larger regionals (BBT, USBancorp) looked good, the rest not so good.  I don't see this as a strong signal the economy is ready to soar.  Amex reported this evening and missed on revenues (a mixed report).

We got a slew of techs reporting after the close.  Seems the MSM is pumping it as a strong showing.  Seemed rather so-so to me.  IBM missed on revenues.  INTC beat on revenues and earnings, but had lowered expectations earlier.  MSFT was pretty much in line.  GOOG laid an egg.  In December ORCL had a notable miss.  Again - not the type of showing of a booming economy.

So we have financials with mixed results and techs with so-so results.  Not the booming economy some want us to believe. These are two large sectors of the economy and I suspect the market on inflated expectations has gotten ahead of reality.   We will see.

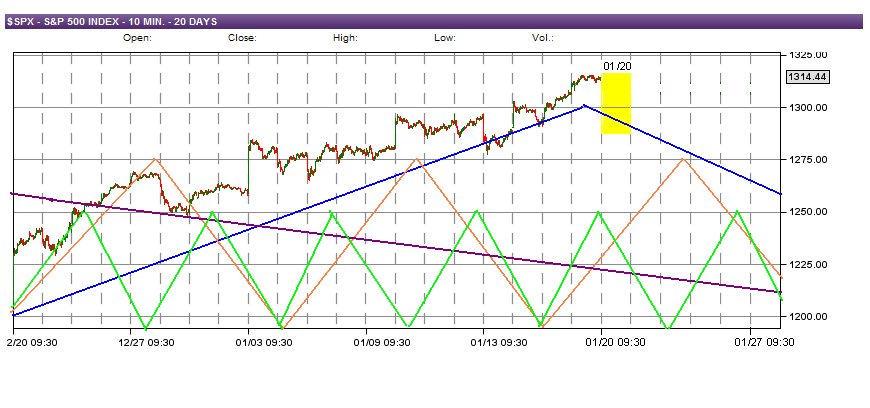
Here is the SPX outlook:

GL traders.  Nothing goes one way forever.  Sold the last of my trading longs today, so I am now short and cash.  The VIX broke 2 std deviations (47.5%) below its Nov 1 high - so 3 consecutive down days (as if that will ever happen again - hehehe) would signal a trend change.

01-19-2012 outlook

We should be at or very near the top.  There is a FIB level at 1310.33 which may well mark the top.  The 35TD cycle DPO (amplitude) is close to being fulfilled.  Other TA indicators are also indicating an imminent top.  Money Flow has ticked down and this normally happens just prior to a top.  RSI is approaching extreme levels.  Here is the big picture:

We have already gotten a sell signal from crossing channel lines.  Now this may have been a bit early, but in my opinion a signal should precede the event (topping in this case) to allow the trader time to consider and act.  Nothing is certain when it comes to the market so we may see marginally higher highs.  We have a shorter cycle topping tomorrow during the day and this should result at least a testing the 1310.33 FIB and may spike above that, but by Friday we should start our descent.  See for yourself:


GL traders.  Hope I am back in sync with the market.