Senin, 11 Juli 2011

Comments and outlook for 07-12

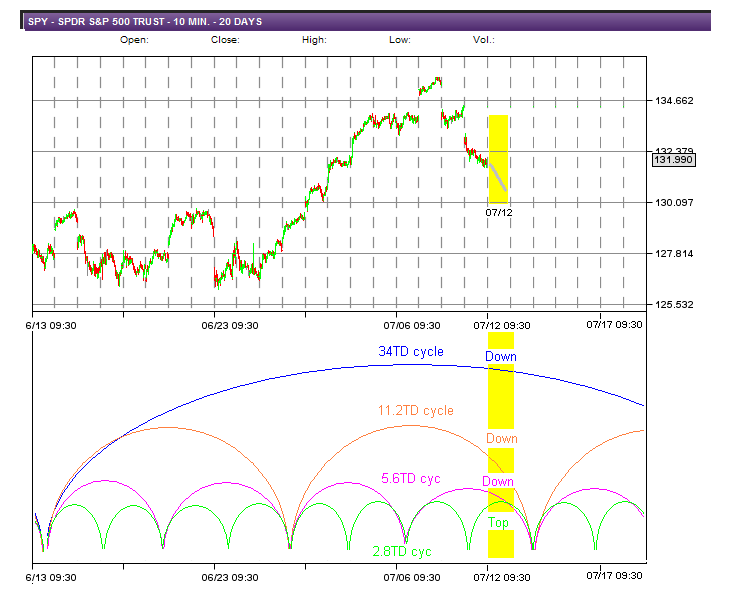
OK, today was down not sideways.  Looking more and more like last Thursday was the top of the 34TD cycle.  That would put the last bottom around June 13.  17 trading days from last Thursday would put the 34TD bottom around  July 29 or Aug 1.  Of course there is a 22TD bottom in mid-July.

So I have adjusted my short term chart to reflect Thursday as the top.  After this adjustment we have the 34TD cycle down, the 11.2TD cycle down, the 5.8TD cycle down and the 2.8TD cycle topping.  And of course the 22TD cycle is down about another week.  So this does not paint a rosy picture for the bulls and tomorrow could/should continue the downtrend of the past 2 days for another 2 days.

Here is a visual:

GL traders.  I hope I finally have the cycles correctly positioned.  Warning: do not feed the bears.     

Minggu, 10 Juli 2011

Comments and outlook for 07-11-2011

If you have been following the thread of posts you know that there appears to have been a change in the dominance of cycles.  It appears that the 33-34TD cycle has resumed a dominance.  The 22TD cycle probably will still show some impact as it bottoms mid-month, but not to the extent as previously assumed.  The 33-34TD cycle should be topping and bottom about 18TD days from now (early Aug).

So Monday the 34TD cycle should be topping.  The 11.2TD cycle should also be topping.  As these 2 cycles top the 5.6TD  and 2.8TD cycles are bottoming.  The 1 year cycle bottoming was evidently more than offset by the strong up move by the 34TD cycle over the past few days.  As I mentioned the 22TD cycle should bottom mid-July.    Over all it looks like a sideways day for Monday with possibly a slight downside bias.  Note:  there may be negative news coming out of Italy which could add to downside pressure.

Here is a chart showing relevant shorter cycles (hope I have them properly positioned):

GL traders.  Watch for the bear.  Do your own analysis.

Jumat, 08 Juli 2011

Comments and the outlook ahead 07-08-2011

If you have not done so I encourage you to look at the comments by Shadow on my last post.  He has some very insightful comments.

I have taken some of those insights and tried to represent them in chart format.  Here is that chart:

GL traders.  Any errors in the chart are by the author not Shadow.  I appreciate the contribution of him, Best and others in my effort to offer you the best information possible.

Kamis, 07 Juli 2011

comments and outlook for 07-08-2011

Missed posting yesterday, sorry about that - was having some back muscle spasm issues and could hardly sit up.  Today I think cleared up some things.  With today's move up I think it is clear the 22TD cycle is no longer in play. 

Now as was discussed some months back when we switched from 34TD (33.75 so it is often referred to as 33TD cycle) is back in play.    If that is the case it may not top before the middle of next week (and would not bottom until in early August.  I have not done the analysis yet, but last time the 33-34TD cycle nested within the 20 week (Wall) cycle which is 100 days or 3X the 33-34TD cycle.  I have never seen the 22TD cycle and 34TD cycle dominant at the same time...  I suppose it could happen.

I have annotated the SPY chart showing this assumption.  The 34TD cycle should be up, the 11.2TD cycle should be up,  The 5.6 and 2.8TD cycles should be down.  This should result in a somewhat sideways day Friday.

Here is the chart:

GL traders.  I hope we are now in sync with the cycles.  We will know in the next 4-5 days, but should have hints along the way.

Rabu, 06 Juli 2011

Comments and outlook for 07-06-2011

Not much to add to yesterday's outlook.  The market action fits within my theory of the cycle alignment from yesterday.  Now we see if it continues.  If it does then today should be down.  How much?  Maybe 1% on the S&P.

Here is an updated SPY chart:

GL traders.  Be careful.  The market is never as predictable as we would like.

Senin, 04 Juli 2011

Comments and outlook for 07-05-2011

This past week is probably the worst week I have had since I started my blog when it comes to getting it right.  So what has changed?  What am I missing?  These are the questions I have been asking myself.

So I have looked at the placement of the 20 week cycle and adjusted its placement.  Not sure of the placement still.  That alone though should not account for the action we saw this past week. I expected the 22TD cycle to top on Thursday (but given it is probably actually 22.5TDs Friday was possible).  The 22TD cycle alone should not account for the amount of rise we saw in the market as we should have had at least some downside pressure from the 1 year cycle as it should bottom this week.

So I ran through several different possibilities, and may have found a possible answer.  Based on prior assumptions the chart would look like this: 

But this does not explain a move up that was extraordinary and one has to look back several years to find a comparable movement in a single week.  You have the 22TD cycle up, the 11.2TD cycle down.  These two cycles would be expected to offset.  So we would expect up/down movement based of the 5.6TD and 2.8TD cycles.  Instead we went up with little or no pullback all week.

So I cane up with a theory that may explain the data as it exists.  What if the 11.2TD cycle shifted 5.6 days so that it and the 22TD cycle were both up last week?  Many cycle analysts refer to this as a cycle inversion.    Then you would have something like this: 

You have the 22TD cycle up (it has 70 points or so of amplitude or 35 points last week) and the 11.2TD cycle up  and it has as much as 50 points of amplitude.  This gives you the potential of 85 points upside last week,  So the fact we got 75 or so points to the upside is accounted for and allows some downside for the 1 year cycle.  As I said - as of now this is a theory that seems to fit what happened last week.  Time will tell if it is the right theory.  If it is right then we now have both the 22TD cycle and 11.2TD cycles down and we should see downside in the coming week starting tomorrow.  It may start with a minor pullback (say 10 points or so on the S&P) and should accelerate through the next 4 days into next Monday if my theory is correct. 

If you have a theory (on cycles) that explains last week's action as well as this or better I would very much like for you to share it.

GL traders.  Do your own analysis.  Feel free to share you ideas and thoughts with others who visit this humble blog. 
Sabtu, 02 Juli 2011

07-2011 the month of July

Would it be interesting if we have seen the highs for the month of July already?  Could happen, but we probably get enough upside Tuesday morning to keep that from happening.  The most interesting cycle in July will be the 22TD cycle.  This cycle has shown enough volatility (amplitude) to dominate in July.

The 22TD cycle should have topped and be ready to turn down.  With an amplitude of 75 points (estimated) by mid-July that could take the market back down under 1270.  The second most interesting cycle is the 20week cycle.  It has an amplitude (estimated) of 87 points.  That is about 1.75 point per day over the 10 weeks (the down leg) or about 19 points over 11 days of the 22TD cycle down leg.  That combined with the 22TD cycle could put the market at 1245-1250 by mid-July.   Now I am not certain of the impact, but the 1 year cycle is ready to bottom and may add another 15 or so points of downside next week.  After mid July the 22TD cycle should recoup a lot of the downside back up to the 1290 area by the end of July is my best estimate.

So in mid July we should be around 1245 (and maybe 1230).   Looking at the FIBS I believe the maximum upside target should be 1361.06 (but may be 1341.67) and the minimum downside target should be 1328.18 (but may be 1247.56).  Here is a fibs table: 

Here is a chart of the SPX highlighting the 22TD and 20 week cycles:
Note the target using DPO to estimate amplitude down from current levels gives a target of 1225-1235.  If we go up another 10 points from here the raise that downside target 10pts etc.  But the downside target is consistent with  with the FIBS mentioned above.

GL traders.  Is there a 4th of July bear out there.  I guess we will see.  Do your own analysis, this should only be one data point in your analysis.  Happy 4th....