My call for yesterday of weakness for most of the day was OK. Looks like my call for the week though will miss the mark unless we get a strong down tomorrow. Which is possible but does not appear to be a strong possibility.
I have shown the longer of the short term cycles (11 and 22 days) and turned down now. Tomorrow will tell us how soon they have an impact. We have other cycles up in the am but turning down duting the day. So I think there is the possibility of some selling in the afternoon.
Here are charts:
GL traders, do your own analysis and protect profits with stop orders.
Kamis, 10 Februari 2011
Rabu, 09 Februari 2011
comments and outlook for 02-10
What do you mean you don't like my EW chart/count? I thought it was cool. OK, enough fun with EW devotees. Today we got a down day. True, not a big down day, but the morning should have shown strength from the short cycles and didn't. Maybe a clue of a change?
Tomorrow the short cycles are down from the open and mostly down all day. So tomorrow could be the substantial down day we have been waiting on. Time will tell. Here is a 10 min chart of the SPY:
Gl traders. Keep your stops tight and do your own analysis.
Tomorrow the short cycles are down from the open and mostly down all day. So tomorrow could be the substantial down day we have been waiting on. Time will tell. Here is a 10 min chart of the SPY:
Gl traders. Keep your stops tight and do your own analysis.
Selasa, 08 Februari 2011
comments and outlook 02-09
I was asked about EW. I don't really do EW, but here is my KISS (Keep It Simple Stupid) version of an EW chart:
As you can see per EW we near a critical point ( 2 X March 09 low) or a FIB of 1.00. Which supports my cycle analysis that this week could well mark a turn and we could even end the week lower.
Looks like strength in the AM and fade in the PM. Keep in mind if the longer cycles kick in you can forget what these short cycles indicate. Here is a short term cycle chart:
GL traders. Be sure to maintain stops and do your own analysis.
Senin, 07 Februari 2011
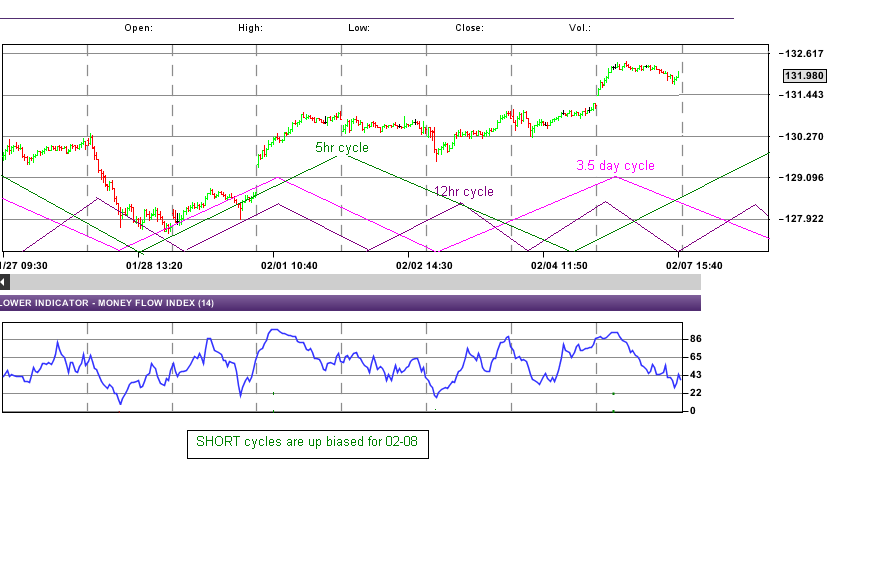
outlook for 02-08
The short cycles are upward biased for tomorrow. I am bearish for the week and expect the longer cycles to take control during the week. If that happens tomorrow you can forget the short cycle bias.
Here is the SPY chart:
GL traders. Do your own analysis. If you have long positions protect yourself with stops.
Here is the SPY chart:
GL traders. Do your own analysis. If you have long positions protect yourself with stops.
Minggu, 06 Februari 2011
Slow Sto signals sell off ahead 2-7
According to Robert McHugh if the Slow Sto stays above 20 for 2.5 months a sell off normally occurs (+/- 2 weeks). Here is the Slow STO:
The Slow STO has now been above 20 for 2.5 months (+/-).
GL traders. Do your own analysis
The Slow STO has now been above 20 for 2.5 months (+/-).
GL traders. Do your own analysis
Sabtu, 05 Februari 2011
Long term cycles environment 2-7
Our weekly outlook discusses the medium length cycles. But what is the longer term environment? The 41 month cycle is down. The 2 year cycle is up. The 1 year cycle is down. Here is the SPX:
Not shown is the 10 year cycle, The more dominant cycles (historically) are the 10 year, the 41 month and 2 year cycles. The 10 year cycle will not bottom until spring of 2012. The 41 month cycle will bottom in the same time frame as the 10 year cycle. The 2 year cycle will bottom after the 10 year cycle in 2012, Supposedly there is a K-wave (about 56 years) cycle that will bottom sometime between 2012-2014.
So the long term cycle environment is fairly negative and these longer cycles should start exerting more influence as they push toward a bottom. I would expect that influence to become more pronounced after mid-Oct when the 2 year cycle tops. Keep in mind - even though a long term cycle may have a large amplitude that influence is spread over many, many days so the daily influence may be small and more than offset by shorter cycles whose daily influence is spread over a much shorter time (fewer days) and have a larger daily influence. In the long run though the persistence of the long term cycles will make its effect felt. That influence becomes most pronounced as the cycles approach a bottom as the shorter cycles become unable to offset the persistent effect of the longer cycles.
GL traders.
Jumat, 04 Februari 2011
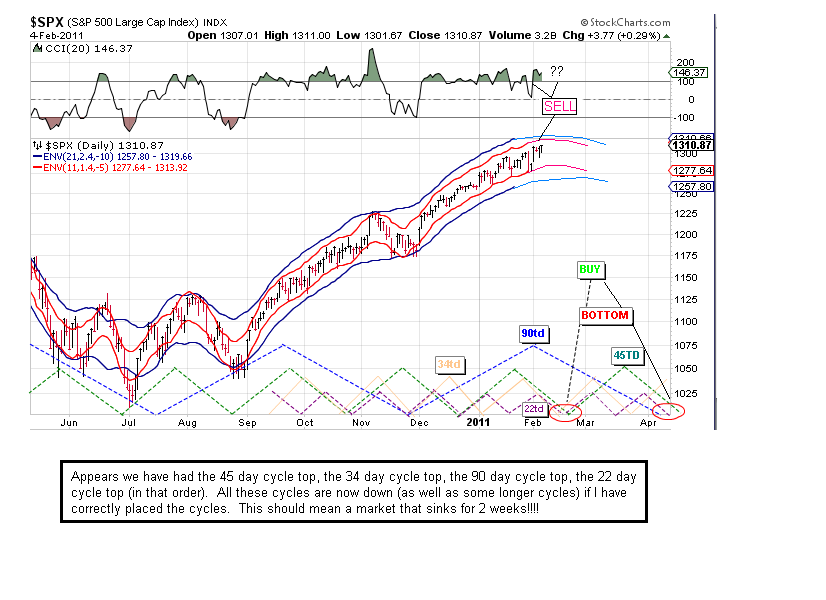
The week ahead 2-7
I had expected a downward bias this past week. Did not happen. I did tell you the market was not ready to fall substantially though and pointed out two cycles that were up for the week (knew it was possible the week would be up, but thought the longer cycles would have a bit more influence than they did). So not a good week as far as my expectations were concerned.
Still the market did not make a great deal of upside progress. All the medium term cycles should (by now) have turned down. I have tried hard to make sure I have positioned all cycles properly - because I felt we are at a turning point.... The evidence is that we have reached that pivot point. Even bears deserve a day, a week or two weeks every now and then. So I am going out on a limb - not only will we be down next week, but we should be down hard. A 5-6% down would not surprise me. Not only will next week be down, but so will the following week. IMO - if we are to get a 10% correction the next 2 weeks is the best setup we have had since last May.
What will trigger the sell off? I am not sure. Today's employment #s could contribute? Egypt? Default by Ireland? Take your pick. Maybe the combination of more than one thing.
Here is the SPX chart:
If you disagree, please state the bullish case for the next 2 weeks. Give me a chance to consider the bullish case and possibly change my mind.
GL traders. Make sure you do your DD. This is as "bearish" as I have been in a few months.
Update: Momey flow (T-theory) is projecting a top Feb 14 (one week from Monday): http://www.ttheory.com/
Langganan:
Postingan (Atom)